Every result names its source
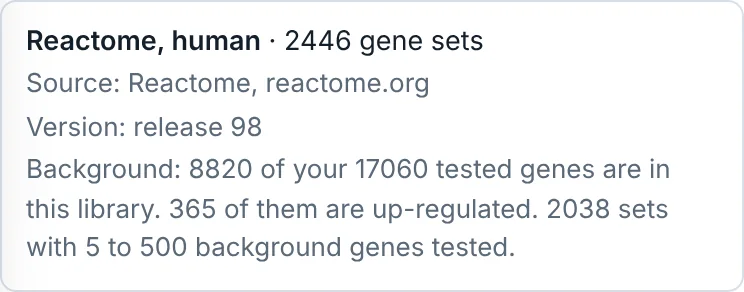
The database, its release and the genes it was tested against, shown with each analysis.
Turn your DE table into plots and pathways. Free, private, and no code.
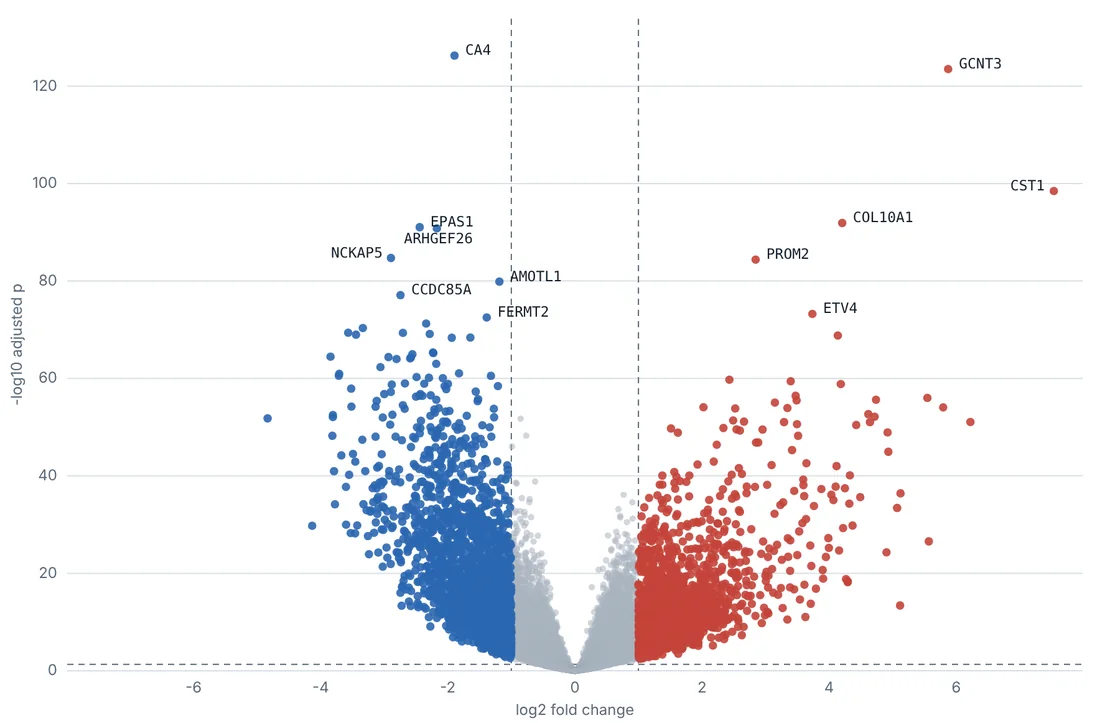
Real data GEO GSE202069 Liver cancer vs non-tumor liver, 24 patients
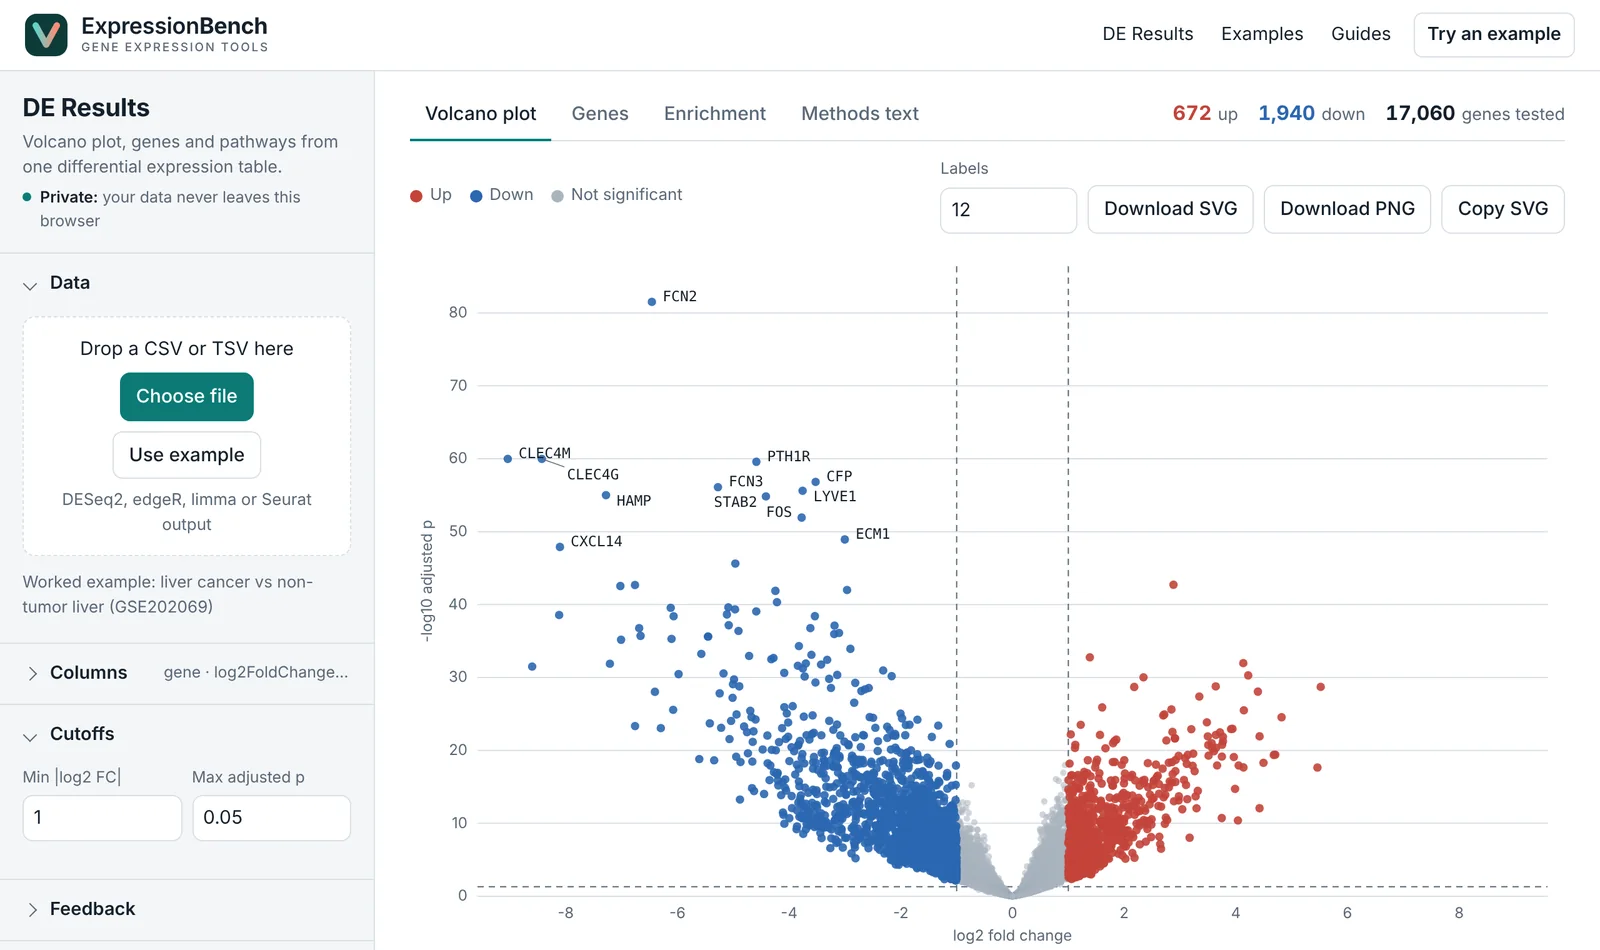
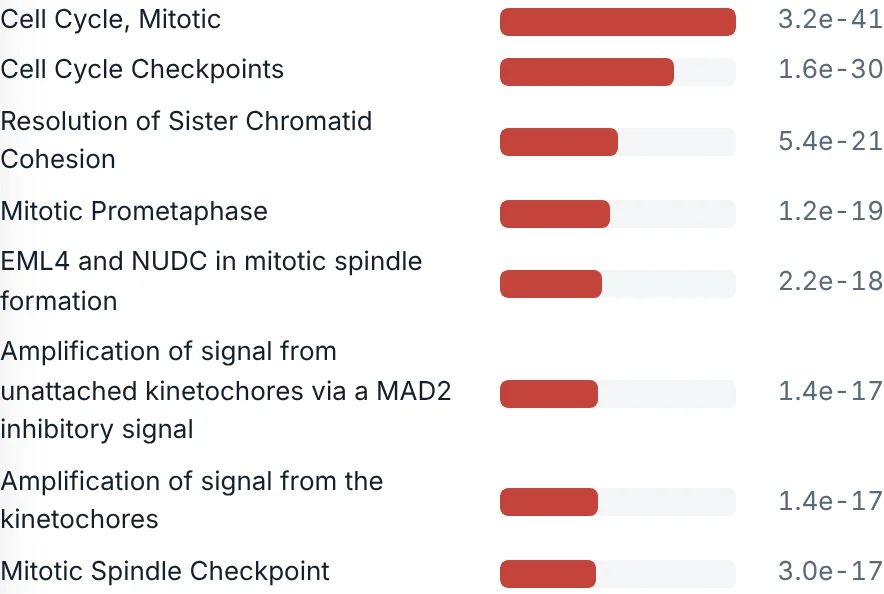
672 genes up, 1,940 down, and Cell Cycle, Mitotic as the top pathway up. See how this result was made.
Established statistics and up-to-date gene databases, with every setting on the record.
Hypergeometric test with Benjamini-Hochberg correction, as used across published research.
Enrichment is measured against the genes you tested, avoiding a common source of false results.
GO, Reactome and WikiPathways, refreshed monthly, with the release named on every result.
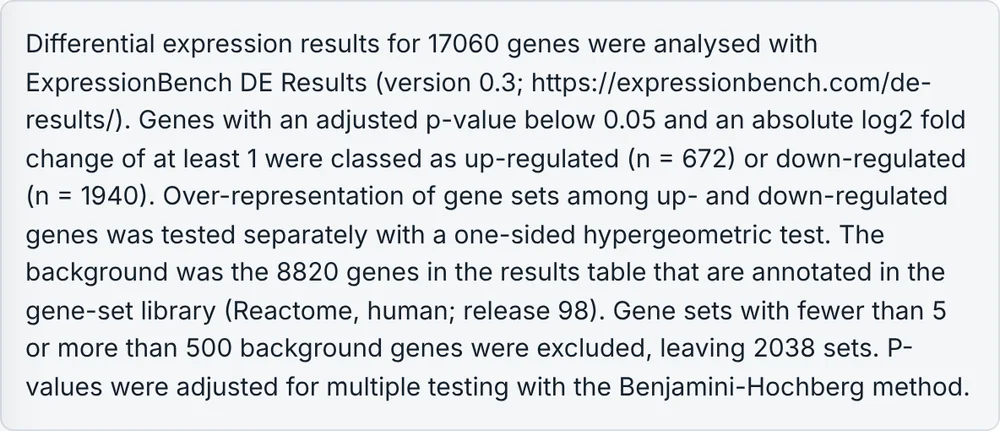
A methods paragraph with the test, cutoffs and versions, ready for your paper.
The database, its release and the genes it was tested against, shown with each analysis.
The test, the cutoffs and the database versions in one paragraph, ready for your paper.
Two public cancer datasets, analysed step by step with every check and file published.
24 patients, GEO GSE202069. Cell division up; the liver's own work down.
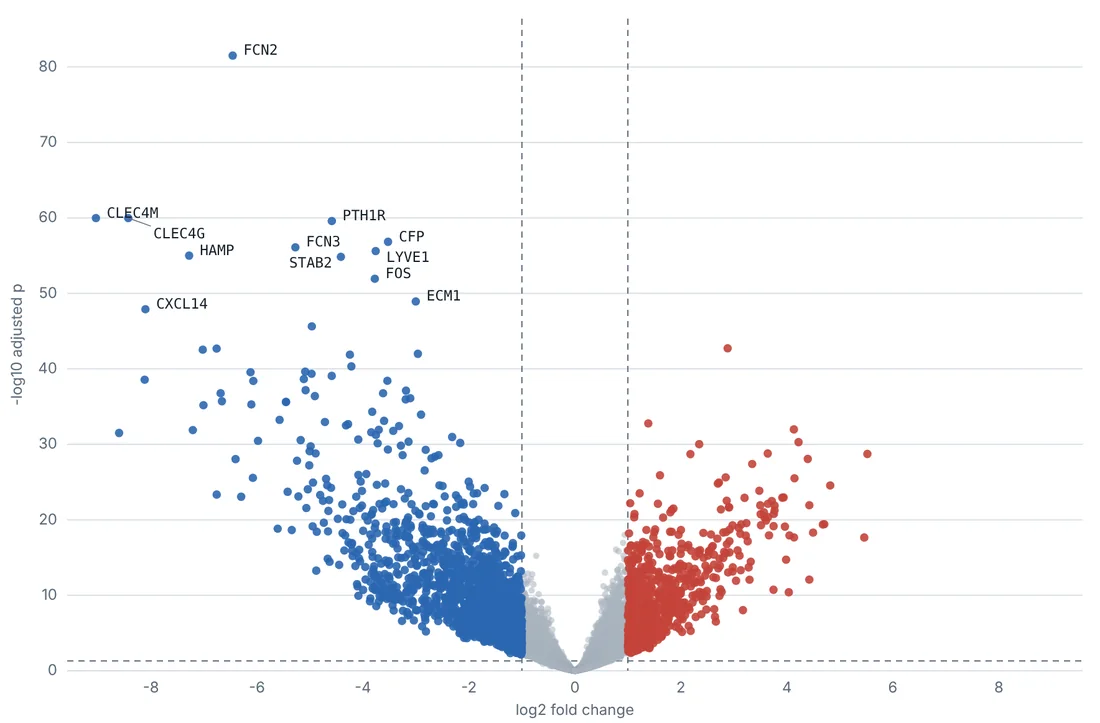
27 never-smokers, GEO GSE87340. Air-sac and blood-vessel genes down.
New to this? The guides explain volcano plots, DESeq2 columns and enrichment in plain words.
The analysis runs on your computer. Your table is never uploaded.
No upload, no account and no waiting on a server. Close the page and your data is gone.
Drop a table and the plot, genes and pathways appear straight away.
Set your cutoffs, label the top genes, and download it as SVG or PNG.
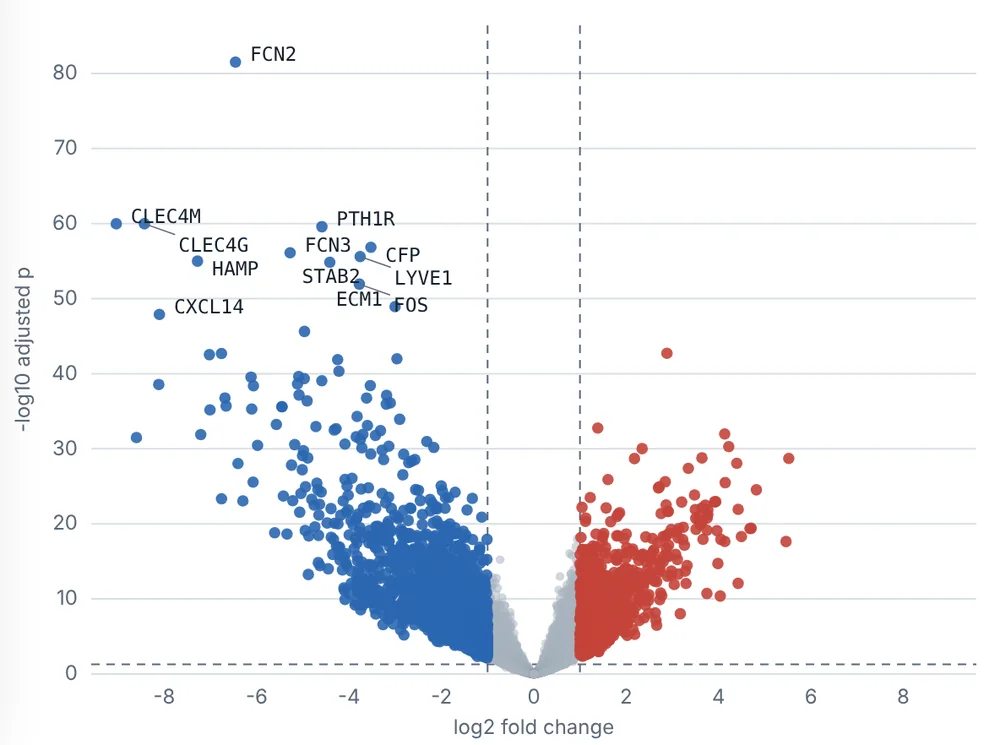
Enrichment for genes up and down, tested separately, with adjusted p-values.