Worked example: liver cancer vs non-tumor liver
Which genes change when liver tissue becomes hepatocellular carcinoma, the most common type of liver cancer? We reanalysed a public dataset in which each patient gave both a tumor sample and a sample of nearby non-tumor liver.
- 24 patients each with a tumor and a matched normal sample
- 17,060 genes tested after setting aside weak genes
- 672 up and 1,940 down in tumors (adjusted p < 0.05, at least 2-fold)
Explore the full results yourself. Open this table in the DE Results tool to see the interactive volcano plot, search for any gene and run pathway enrichment.
Open in DE ResultsThe study
The series has 66 samples from 41 patients with hepatocellular carcinoma: 41 tumors and 25 non-tumor liver samples. Some patients were later treated with anti-PD-1 immunotherapy. The authors' own question was about fat-processing genes and response to treatment. We ask a simpler one: what differs between tumor and non-tumor liver in the same person.
Original paper: Li B and colleagues, Nanjing Drum Tower Hospital. Multiomics identifies metabolic subtypes based on fatty acid degradation allocating personalized treatment in hepatocellular carcinoma. Hepatology 2024;79(2):289-306. doi:10.1097/HEP.0000000000000553. Data: GEO GSE202069.
What we compared
We used the patients who gave both a tumor and a non-tumor sample. The 16 tumors coded “PT” come from the immunotherapy group and have no matching non-tumor sample, so they can't be part of a within-patient comparison.
We used 48 samples: 24 tumors and 24 normal, from 24 patients. The read counts are NCBI's own, made with one standard pipeline for every public human dataset. The samples used and the samples left out, with reasons are listed in full.
Quality checks
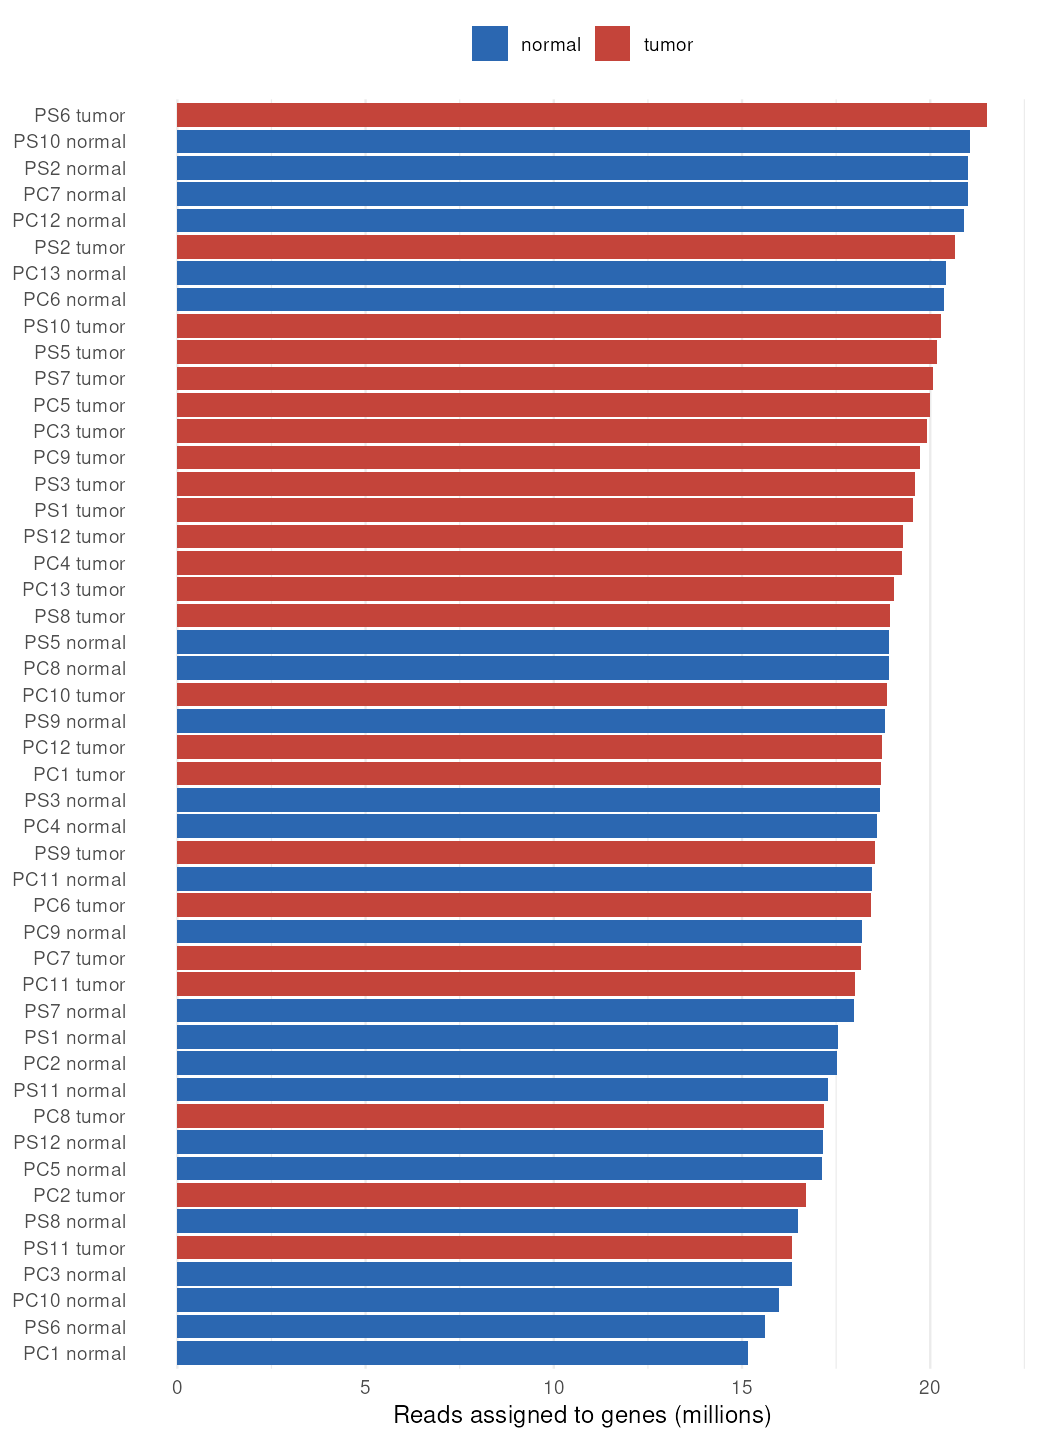
Sequencing depth. Each sample had 15.2 to 21.5 million reads counted on genes (median 18.8 million), which is plenty for this kind of analysis. See the depth of every sample.
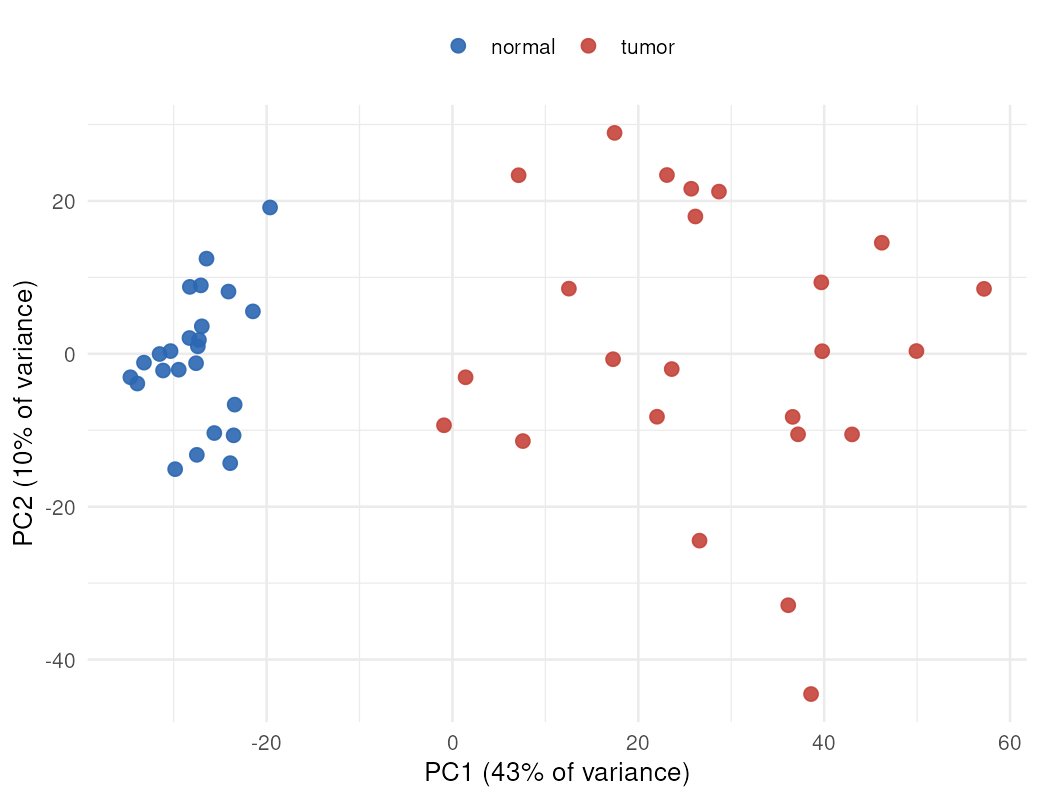
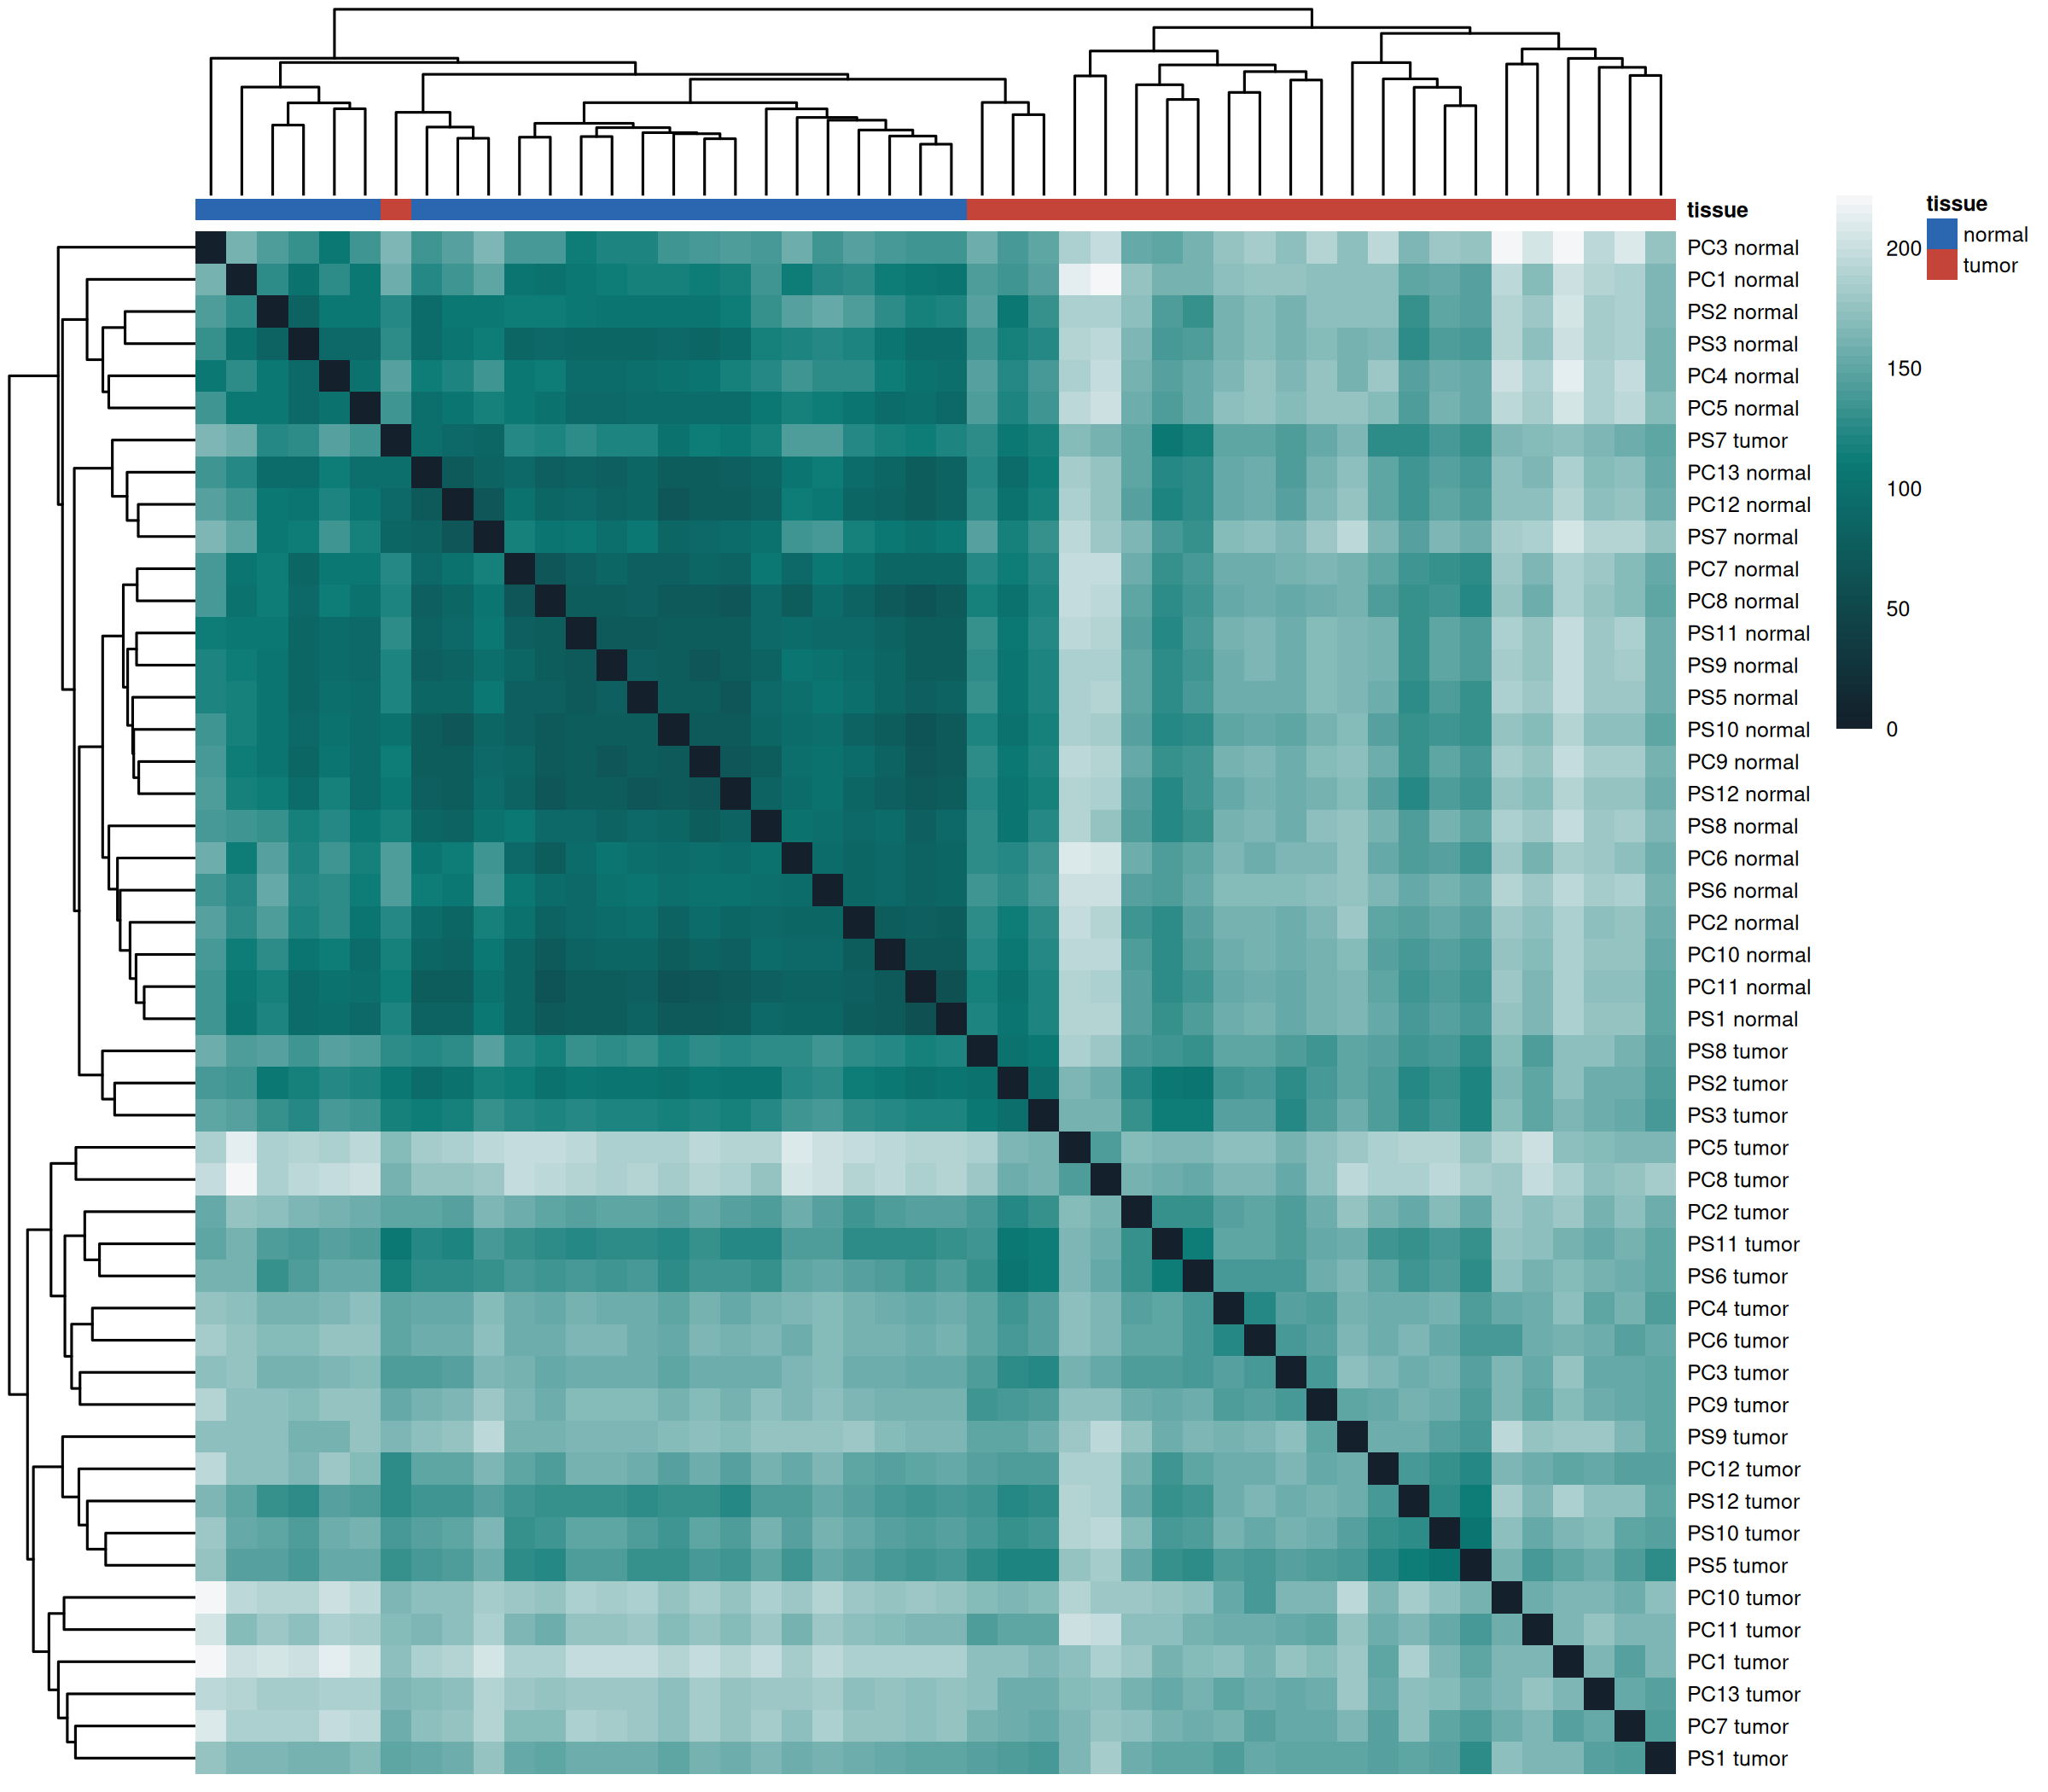
One pair left out because its labels look swapped. For patient PS4, the sample labelled non-tumor sits among the tumors on the sample map, and the sample labelled tumor sits among the non-tumor samples. Both fail the label check. A swap of two tubes is the simplest explanation, but we can't confirm it, so we left the pair out rather than relabel it. With the pair included, 2,266 genes count as clearly changed instead of 2,612; the overall picture is the same.
The label check for every sample and a sample-to-sample similarity map are available too.
Results
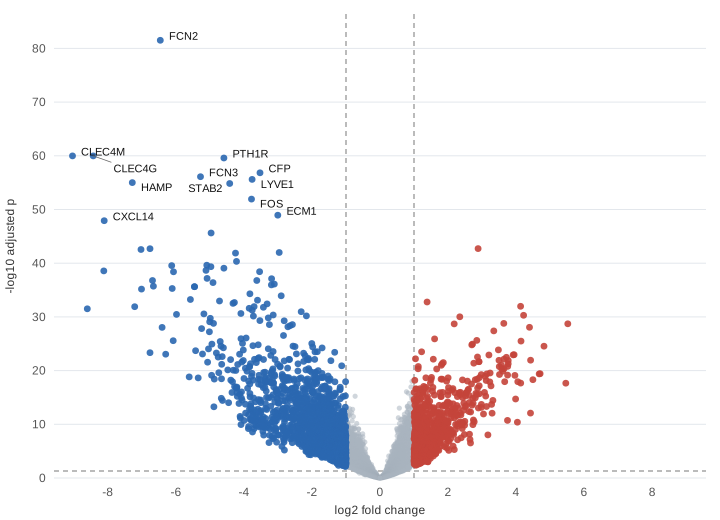
Of 17,060 genes tested, 8,886 differ with an adjusted p-value below 0.05. Many of those changes are small. Requiring at least a doubling or halving leaves 672 genes up and 1,940 down in tumors.
Strongest evidence: higher in tumors
| Gene | log2 fold change | Adjusted p |
|---|---|---|
CAP2 | +2.88 | 1.9e-43 |
CCT3 | +1.39 | 1.7e-33 |
CENPF | +4.13 | 1.1e-32 |
IQGAP3 | +4.22 | 5.1e-31 |
PLVAP | +2.35 | 9.6e-31 |
ASPM | +3.64 | 1.6e-29 |
AKR1B10 | +5.52 | 1.9e-29 |
KPNA2 | +2.18 | 2.0e-29 |
MELK | +4.39 | 8.7e-29 |
APLN | +3.35 | 4.1e-28 |
Strongest evidence: lower in tumors
| Gene | log2 fold change | Adjusted p |
|---|---|---|
FCN2 | -6.46 | 3.1e-82 |
CLEC4M | -9.04 | 1.1e-60 |
CLEC4G | -8.43 | 1.1e-60 |
PTH1R | -4.59 | 2.6e-60 |
CFP | -3.53 | 1.5e-57 |
FCN3 | -5.28 | 7.9e-57 |
LYVE1 | -3.76 | 2.5e-56 |
HAMP | -7.28 | 1.0e-55 |
STAB2 | -4.42 | 1.4e-55 |
FOS | -3.78 | 1.2e-52 |
A log2 fold change of +1 means twice as active in tumors; -3 means one eighth as active. The tables are ordered by strength of evidence, not by size of change.
Pathways
We ran the DE Results tool's own enrichment analysis on this table, with its default settings: genes at least 2-fold changed with an adjusted p-value below 0.05, gene sets of 5 to 500 genes, and the tested genes as the background. Up and down genes are tested separately. These are the same results you get by opening the example and choosing each library.
- Up in tumors: cell division, in every library. Mitotic cell cycle and chromosome segregation (GO), Cell Cycle, Mitotic (Reactome) and Retinoblastoma gene in cancer (WikiPathways) all point the same way as the cell-division genes in the gene table.
- Down in tumors: work the healthy liver does. Drug and toxin processing (Metapathway biotransformation Phase I and II) and fat breakdown (Fatty acid omega oxidation) are lower, as are complement pathways. The healthy liver makes most complement proteins, such as C1R, C1S, C8A, C9 and MBL2, so these fall when tumor replaces liver tissue.
- Read the genes, not just the pathway names. Many of the changed genes behind the top Reactome complement results are antibody genes (names starting IGH, IGK or IGL): 34 of 40 in “Classical antibody-mediated complement activation”, for example. Those suggest fewer antibody-making immune cells in the tumors than in the surrounding liver, which is a change in the mix of cells rather than in what liver cells do.
GO Biological Process: genes higher in tumors
207 of 7,038 gene sets with FDR < 0.05. Background: 12,342 tested genes in this library, 520 of them higher.
| Gene set | Genes | Fold | FDR |
|---|---|---|---|
| mitotic cell cycle process (GO:1903047) | 105 / 450 | 5.5 | 2.3e-46 |
| chromosome segregation (GO:0007059) | 66 / 258 | 6.1 | 2.1e-30 |
| nuclear chromosome segregation (GO:0098813) | 55 / 175 | 7.5 | 4.3e-30 |
| chromosome organization (GO:0051276) | 73 / 336 | 5.2 | 3.2e-29 |
| nuclear division (GO:0000280) | 61 / 235 | 6.2 | 1.2e-28 |
Reactome: genes higher in tumors
120 of 2,038 gene sets with FDR < 0.05. Background: 8,820 tested genes in this library, 365 of them higher.
| Gene set | Genes | Fold | FDR |
|---|---|---|---|
| Cell Cycle, Mitotic | 100 / 487 | 5.0 | 3.2e-41 |
| Cell Cycle Checkpoints | 64 / 254 | 6.1 | 1.6e-30 |
| Resolution of Sister Chromatid Cohesion | 37 / 114 | 7.8 | 5.4e-21 |
| Mitotic Prometaphase | 45 / 191 | 5.7 | 1.2e-19 |
| EML4 and NUDC in mitotic spindle formation | 33 / 104 | 7.7 | 2.2e-18 |
GO Biological Process: genes lower in tumors
612 of 7,038 gene sets with FDR < 0.05. Background: 12,342 tested genes in this library, 1,423 of them lower.
| Gene set | Genes | Fold | FDR |
|---|---|---|---|
| immune effector process (GO:0002252) | 100 / 267 | 3.2 | 6.1e-25 |
| humoral immune response (GO:0006959) | 67 / 142 | 4.1 | 6.2e-23 |
| immune response-regulating cell surface receptor signaling pathway (GO:0002768) | 87 / 235 | 3.2 | 2.2e-21 |
| activation of immune response (GO:0002253) | 99 / 316 | 2.7 | 1.6e-18 |
| complement activation (GO:0006956) | 32 / 43 | 6.5 | 1.6e-18 |
Reactome: genes lower in tumors
104 of 2,038 gene sets with FDR < 0.05. Background: 8,820 tested genes in this library, 1,063 of them lower.
| Gene set | Genes | Fold | FDR |
|---|---|---|---|
| Creation of C4 and C2 activators | 47 / 48 | 8.1 | 2.3e-39 |
| Complement cascade | 64 / 88 | 6.0 | 3.8e-37 |
| Initial triggering of complement | 50 / 56 | 7.4 | 4.3e-37 |
| Classical antibody-mediated complement activation | 40 / 40 | 8.3 | 4.6e-35 |
| Immunoregulatory interactions between a Lymphoid and a non-Lymphoid cell | 73 / 121 | 5.0 | 1.8e-34 |
“Genes” is how many of the set's genes changed, out of all the set's genes in the background. “Fold” is how many times more changed genes the set has than expected by chance. Releases: GO Biological Process ontology release 2026-07-26, human annotations generated 2026-05-21; Reactome release 98; WikiPathways release 2026-11-10. All significant gene sets from all three libraries, with their genes: enrichment.txt. The tool's library releases are refreshed monthly, so results in the tool may differ slightly from those shown here.
What the results show
- Genes of the liver's own blood-vessel lining go down. FCN2, CLEC4G, CLEC4M, STAB2 and LYVE1 are made by the specialised cells that line the small blood vessels of healthy liver. Their loss in liver tumors is well documented: tumor blood vessels look more like ordinary capillaries.
- Jobs of healthy liver cells go down. HAMP makes hepcidin, the hormone that controls iron, and CYP2E1 is an enzyme that processes drugs and alcohol. Both are made in large amounts by healthy liver cells and much less by these tumors.
- Known liver cancer markers and cell-division genes go up. GPC3 and AKR1B10 are both used as markers of hepatocellular carcinoma. TOP2A, MKI67, CENPF and ASPM are needed for cell division, which fits tumors dividing faster than normal liver.
- AFP changes only a little here. AFP is the best-known blood test for liver cancer, but only some tumors make a lot of it. Its small average change across these patients is a reminder that one gene rarely tells the whole story.
These are broad patterns that match what is already known about this cancer, which is a useful sign the analysis behaves as it should. They are not new findings.
Limits
- The non-tumor liver comes from people with liver cancer, and often with long-term liver disease. It isn't the same as healthy liver.
- The sample codes C and S mark two patient groups in the original study. Their meaning isn't stated in the GEO record, so we treat them only as part of each patient's identity.
- A tumor sample is a mix of tumor cells, immune cells and supporting tissue, so some changes reflect a different mix of cells rather than changes inside cancer cells.
- This is a teaching example, not medical advice.
How we ran it
DESeq2 1.50.2 in R 4.5.2 (Bioconductor 3.22), comparing tumor with normal within each patient (design ~ donor + tissue). Genes were kept if they had at least 10 reads in at least 24 samples. P-values were adjusted with the Benjamini-Hochberg method, and fold changes were shrunk with apeglm 1.32.0. Each step explained in plain words.
The volcano plot and pathway results were made by the DE Results tool itself (version 0.3), run on the results table in a browser, not by separate code.
Files: full results for every tested gene · pathway results · volcano plot (SVG) · summary · downloaded files and checksums · software versions · code: download step, analysis step and tool step. The analysis ran in a fixed Bioconductor container: ghcr.io/bioconductor/bioconductor_docker@sha256:e34177896c1579f66d48b756e4229b58237499183a089da084af72d7aba1d40a.
If you use these results, please cite the original study above. Our reanalysis may differ from the authors' own results because the read counts, filtering and statistical method differ.